|
|
|
The near-field measure is used to overcome the effects of low frequency standing waves caused by diffractions and room reflections; at this low frequencies the driver diaphragm acts like a rigid piston and the near-field measure is directly proportional to the far field one and is not affected by the environment in which the driver is. This technique is not full range, it's upper frequency limit is determined by the effective cone diameter: Fmax = 10950/D where D is in centimeter or Fmax = 4311/D with D in inches. To know D just look at the driver specification sheet, or calculate it from the Sd using the formula D=2*(Sd/3.14)½ or measure the diameter with a ruler not considering the foam suspension. So in the Focal case, D=15 so Fmax = 730 Hz that means that we can use the near-field response till this frequency. However this is valid for a driver mounted on infinite baffle, while lowers for a driver mounted on a panel, cause of the baffle effects, as reported by C. J. Struck & S. F. Temme. Just use the baffle dimension instead of the driver diameter, in the seen formulas. In our case, the baffle dimension is 22 cm therefore Fmax = 10950/22 = 498 Hz.
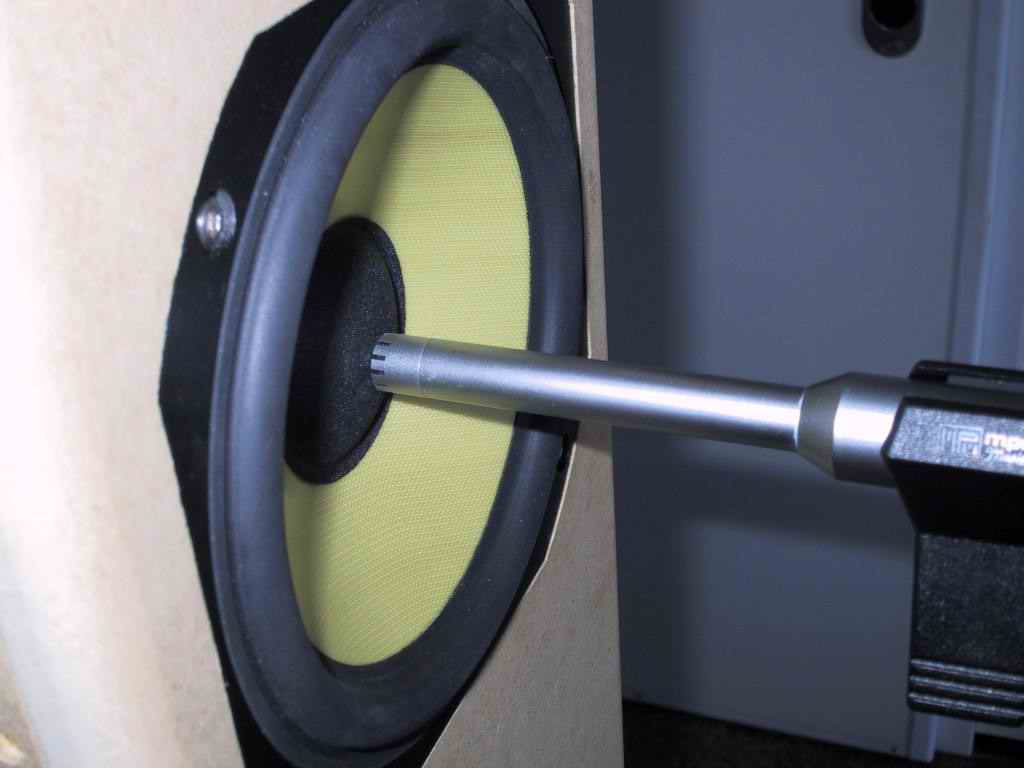
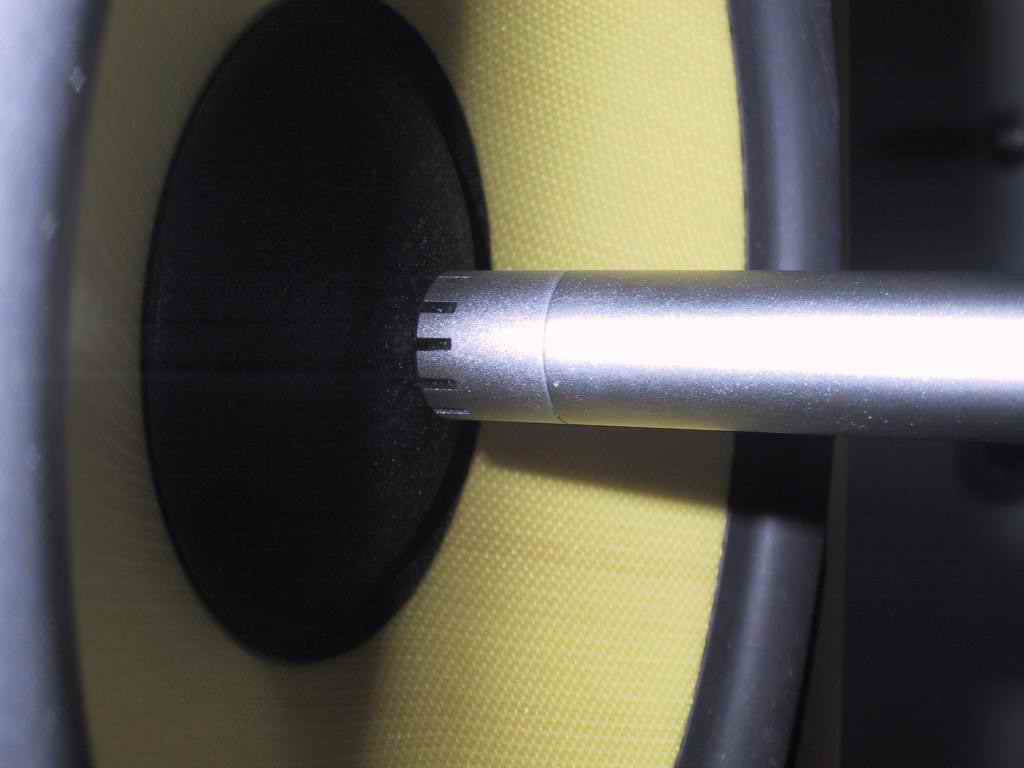
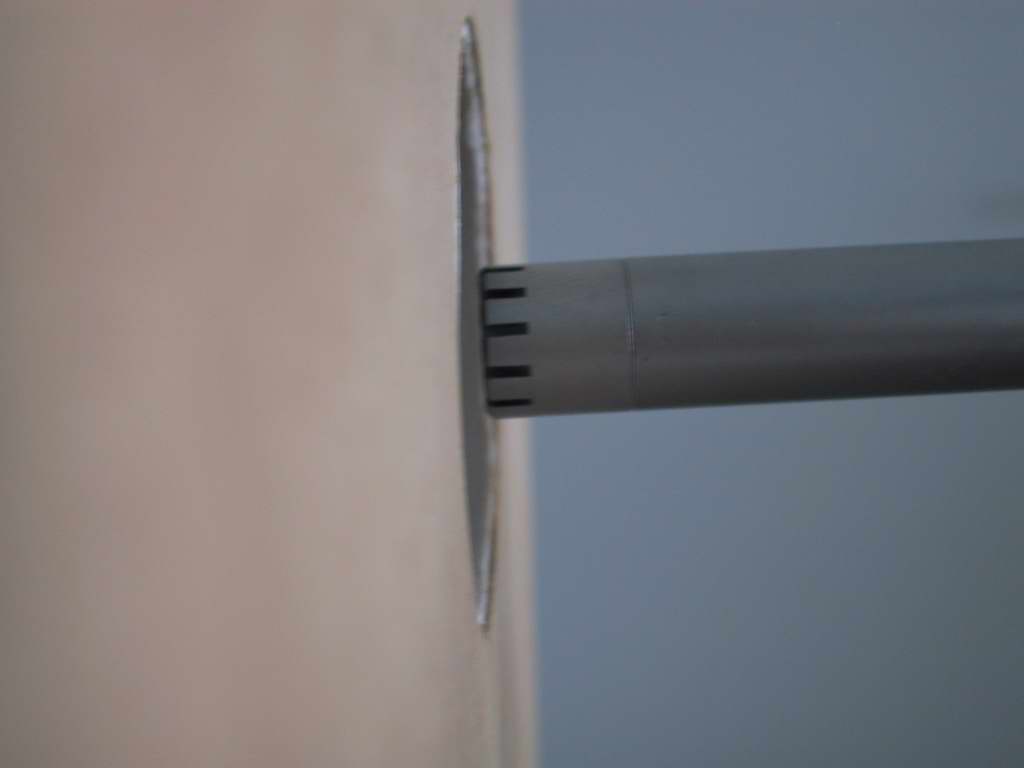
The microphone has to be placed very close to the driver center, but not attached to it; the maximum distance between the two is given by the multiplication 0.055*D, as written by D. B. Keele, so the Focal center cone will be as close to the mic as possible but not more than 0.8 cm. Take a look at these pictures:
|
|
|
With
everything connected as described in the cables section, and the
volumes set to get a 20-25k (depending on your card clipping level)
on both channels of Speaker Workshop VuMeter, Sample Rate and Sample
Size to the maximum that works best with your card as you tested in
the SW Setup section, choose a REPEAT COUNT of 5 (in
OPTIONS/ PREFERENCE/ MEASUREMENTS) or more, depending on your test-room noise and
used Sample Size (I use 20 repeat), and check that the USE PRE-EMPHASIS box is unmarked. Then click twice on
![]() and then on
and then on
 or click on MEASURE/ FREQUENCY RESPONSE/ NEAR FIELD; check SW VuMeter
to be sure the values are almost equal for the left and right channel
and in the 20-25k range; a new file will be created: "Focal
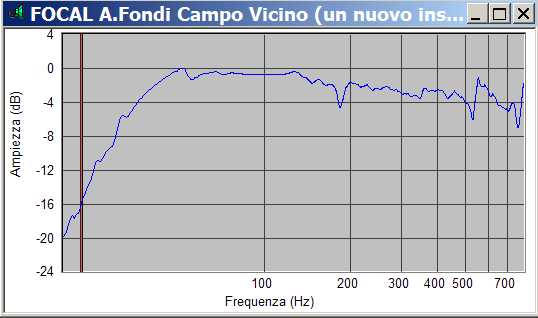
A.Nearfield", open it and take a look at the chart.
or click on MEASURE/ FREQUENCY RESPONSE/ NEAR FIELD; check SW VuMeter
to be sure the values are almost equal for the left and right channel
and in the 20-25k range; a new file will be created: "Focal
A.Nearfield", open it and take a look at the chart.
|
|
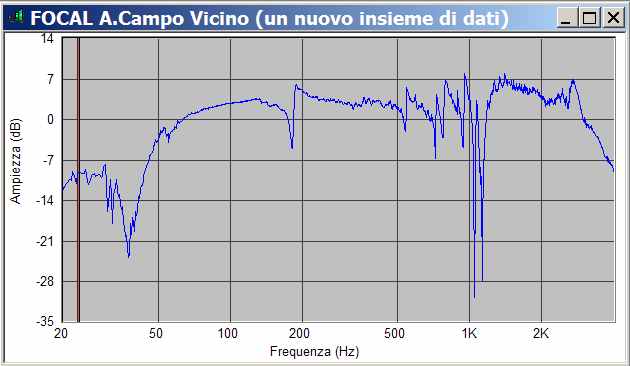
Do you remember the peak at 180 Hz in the Speaker impedance graph? Here you can see that what we see in the impedance plot will be repeated in the frequency response; the DIP at around 38Hz is the vented system tuning frequency since, at this frequency, the tuned box-port combination put its maximum load on the woofer diaphragm. Take a look at the measured speaker impedance, and see what is the Fb (looking at the zero phase point between the two peaks): is should be equal to the DIP frequency! There's another anomaly just after 50 Hz, but I decided not to investigate since this speaker is just for testing; I will see if it is still there when I will start the Double Chamber Reflex measurement. Since reflex enclosures use port, we have to measure and add it; to better clarify the procedure, here's a prospect:
1) Measure the driver
2) measure the first port with the same volume settings of item 1
3) (optional) measure the second port with the same volume settings of item 1
4) (optional) sum the two ports measures into one measure
5) combine item 1 with item 4, in the case of two ports, or item 1 with item 2, in the case of one port
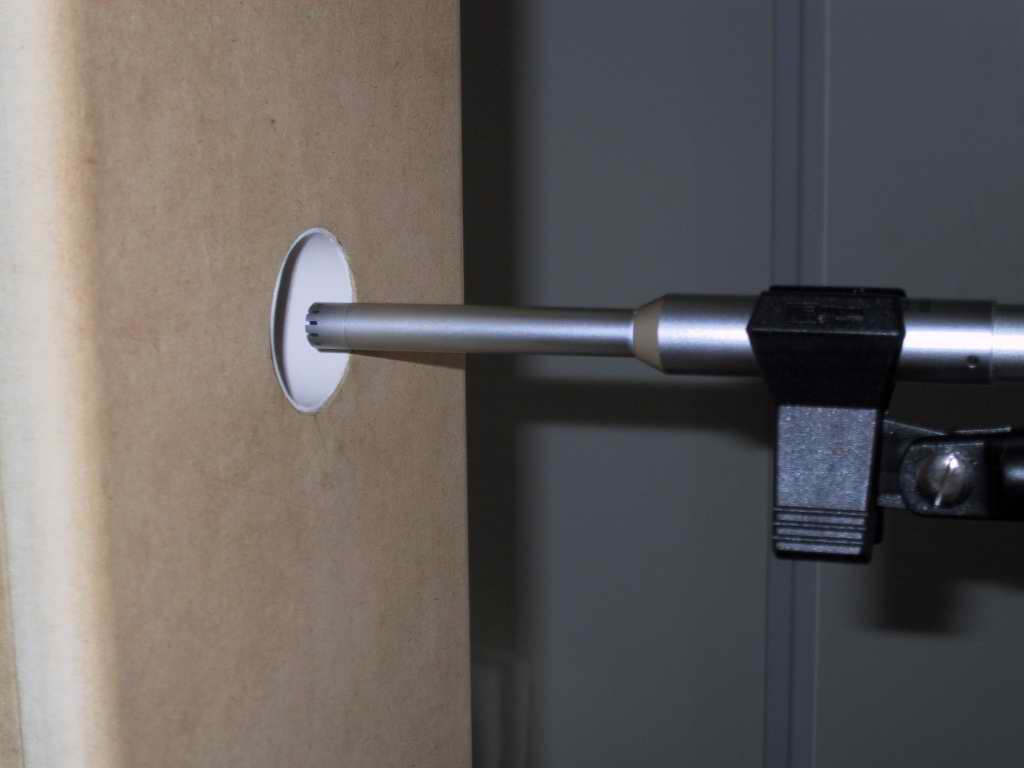
So after taking the near-field response of the driver, and not touching any of the volume settings used, put the microphone in the center of the port and flush with it (not inside the port):
|
|
|
Then
click on or click on
 or MEASURE/ FREQUENCY RESPONSE/ PORT RESPONSE; a new file will appear,
"FOCAL A.PORT". In case there is a second port rename the
new file ("FOCAL A.Port high") and place the mic on the second
port; repeat the measure and rename the new file for "FOCAL A.Port
low". If only one port is used, jump down to item 5:
or MEASURE/ FREQUENCY RESPONSE/ PORT RESPONSE; a new file will appear,
"FOCAL A.PORT". In case there is a second port rename the
new file ("FOCAL A.Port high") and place the mic on the second
port; repeat the measure and rename the new file for "FOCAL A.Port
low". If only one port is used, jump down to item 5:
|
|
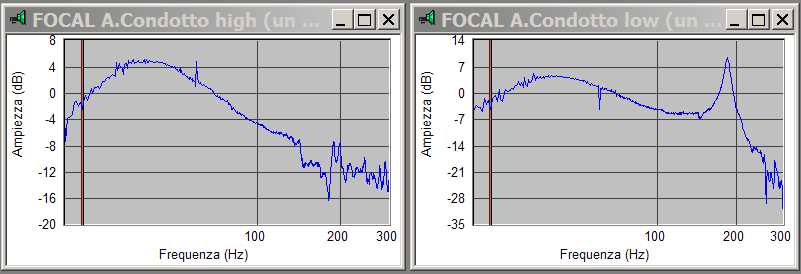
Now
we have to sum the two ports response: highlight the first port
chart, then click on CALCULATE/ COMBINE and choose ADD and select the
second port file in the lower window then click on
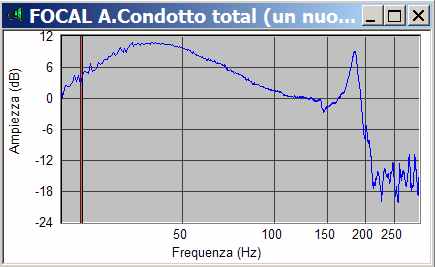
 and the "FOCAL A.Port high" graph will change (I am used to
rename the total ports file so I don't make mistake in the future, I
called it "FOCAL A.Port total"):
and the "FOCAL A.Port high" graph will change (I am used to
rename the total ports file so I don't make mistake in the future, I
called it "FOCAL A.Port total"):
|
|
|
Here
we are at item 5 where we have to merge driver and port
measurements: double click on
![]() then DRIVER/ MERGE PORT RESPONSE; in the new window that appears,
select the appropriate near-field driver and port responses;
press the
then DRIVER/ MERGE PORT RESPONSE; in the new window that appears,
select the appropriate near-field driver and port responses;
press the
![]() to select from the resource tree. In this case the two near-field
files are the driver one ("Focal A.Nearfield") and the port(s)
one ("FOCAL A.Port total"); then in the PISTON AREA you will see
the value of Sd as is in the driver properties (just check
they are the same); finally you have to write the area of the port in
the enclosure (R2*3.14 where R is the port radius);
remember to double the port area if are using two ports. Click on
to select from the resource tree. In this case the two near-field
files are the driver one ("Focal A.Nearfield") and the port(s)
one ("FOCAL A.Port total"); then in the PISTON AREA you will see
the value of Sd as is in the driver properties (just check
they are the same); finally you have to write the area of the port in
the enclosure (R2*3.14 where R is the port radius);
remember to double the port area if are using two ports. Click on
![]() and a new file will be created, "FOCAL A.Merge NearField":
and a new file will be created, "FOCAL A.Merge NearField":
|
|
|
That's it guys, our near-field response is ready but usable for a limited range, 498 Hz and doesn't show neither baffle diffraction nor baffle step. In the chart the phase module is not visible but I will show you, in another moment, how useful it can be in deciding the network frequency: for now we need to measure the far field response.