|
|
|---|
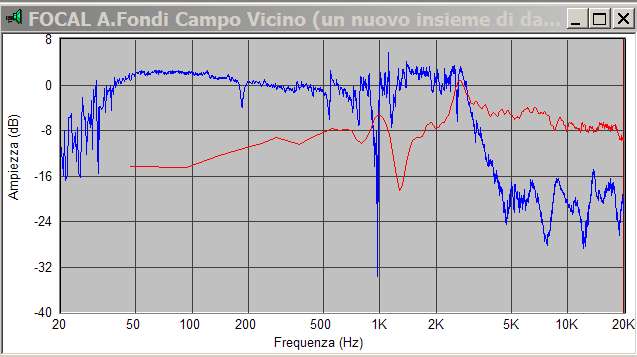
We are arrived, finally, at the last point in which we will splice together the near-field response with the far-field one to obtain the complete speaker response as you see in the Hi-Fi magazine. Since the two responses have different levels we need to scale down the near-field one, so open it and, by double clicking in it, ADD the gated far-field response, the one measured On Axis with the Acoustic Center and with all the drivers working:
|
|
|---|
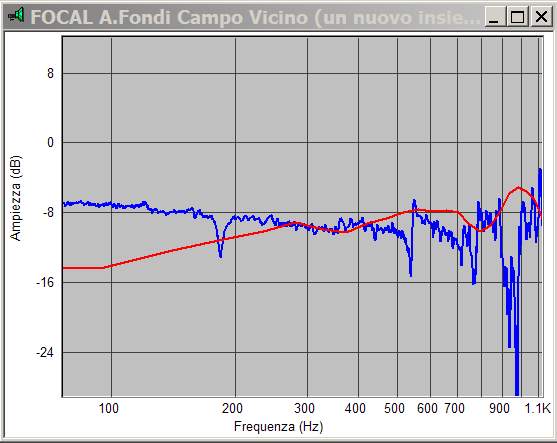
Before scaling, we have to decide at which frequency the splice will occur, knowing that it has to happen in the range delimited by the far-field lower limit (250Hz) and the near-field higher limit (498Hz). So taking a look at the blue response, the 200-500 Hz region is flat therefore ideal for our purpose; the red line shows a possible point in the 300-400 Hz area, so I decide for a joint frequency of 350 Hz. Once decided the frequency, we can scale down: click on TRANSFORM/ SCALE :
|
|
|---|
Since
the near-field has an higher amplitude, we have to choose SUBTRACT
and in the dB write a value of 10 to start, that is a 10 db amplitude
subtraction is performed on the NF graph. Click on
 to instantly see the result; keep changing the dB value till you are
satisfied with the result; use the ZOOM option to limit the area of
interest to better see it. When done, click on
to instantly see the result; keep changing the dB value till you are
satisfied with the result; use the ZOOM option to limit the area of
interest to better see it. When done, click on
 to make permanent the scaling:
|
|
|---|
Now eliminate the Far-field response from the near-field chart and close it. Then open the gated far-field response "Focal A.Gate Total" and click on CALCULATE/ SPLICE :
|
|
|---|
The A is the source dataset (the dataset currently being viewed) and is not editable.
The
B is the near-field response, click on
 and select the file.
Frequency: select the frequency at which the splice takes place.
Methods:
either A or B can be the high frequency portion of the result. Also,
the frequency resolution can be based on A or B data. Check the
appropriate boxes to use B rather than A (the default). In our case,
A has the higher frequency, while B the better resolution. Select
to perform the splice, and a new file with a Splice suffix is
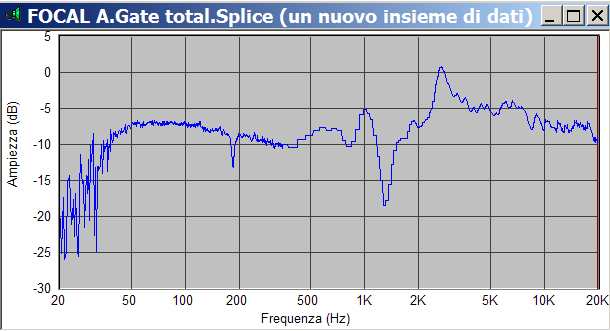
created: "Focal A.Gate Total.Splice":
|
|
|---|
To give a better look, we need to smooth the response: click on TRANSFORM/ SMOOTH :
|
|
A
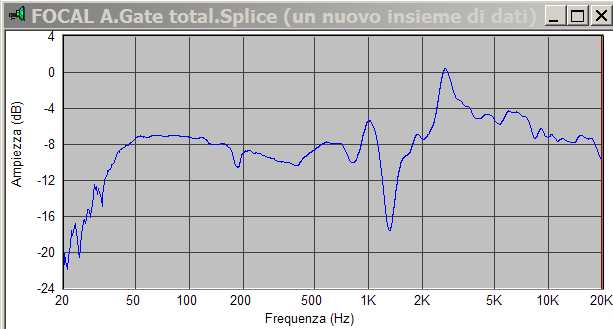
1/8 octave should be sufficient; click on
to see the result that isn't permanent till you click on
:
|
|
|---|
The chart is not very nice for sure, but as I said before this was just a test, whose intent was to show how to use Speaker Workshop. One more measurement is waiting for us, the not-gated one!