Once
we have the speaker ready, we can measure the mounted woofer impedance that will
give us useful information; we will be able to see the speaker tuning frequency,
the interaction between the driver and the box. We will use the same connections used previously for the measurement of the
impedance in free air with the only difference that DUT Cable will be connected
to the in box mounted woofer; the volumes setup are those ones till now used,
same for the sampling frequency; practically we use the same settings used during the measurement
in free air, just check that the REPEAT COUNT is at 10 or more. Double click
on ![]() and then on
and then on ![]() or MEASURE/ IMPEDANCE and wait till the measurement ends; then open the new
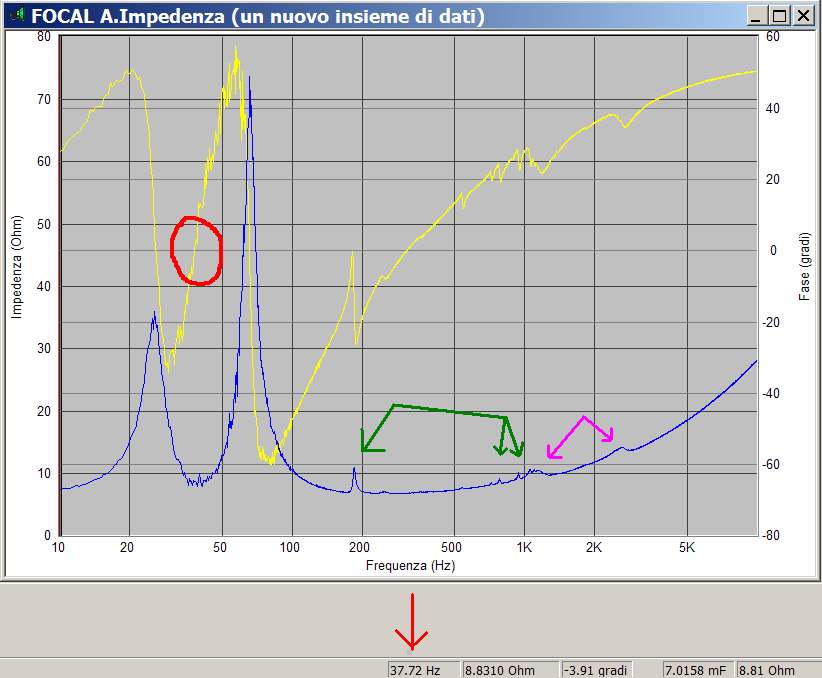
created file "FOCAL A.Impedance" and the chart
will be visible; the system used here is a tall reflex speaker (959x188x218 mm)
with two tuning ports and without any acoustic absorbent:
or MEASURE/ IMPEDANCE and wait till the measurement ends; then open the new
created file "FOCAL A.Impedance" and the chart
will be visible; the system used here is a tall reflex speaker (959x188x218 mm)
with two tuning ports and without any acoustic absorbent:
|
|
The
impedance curve of a driver mounted in closed box has one "peak" as it happens for the
driver in free air, but this peak is no more placed at the resonance frequency (Fs) but
is found at the resonance frequency of the closed box (Fc) that is
always greater than the Fs and inversely proportional to the box volume. In a
reflex system the impedance curve introduces two peaks, one (Fl) placed
at a frequency lower than Fs, the other (Fh) at a frequency higher than Fs; between the two peaks there is a
dip whose minimum corresponds to the tuning frequency of the reflex
box (Fb). A more precise way to know the system tuning frequency, is to look
at the impedance phase: watching the chart, that refers to a reflex system, we can
acknowledge which is the Fb placing the mouse cursor where the phase (yellow line) assumes
zero value between the two peaks (red circle) and reading
the value in the State Bar (red arrow); the phase assumes equal
to zero value in three points that are the two impedance peaks (Fl,Fh) and the minimum of the
dip (Fm). Another way to calculate the Fb
(J. E. Benson) is to carefully close the port(s) using a piece of
wood with sealing material and measure its impedance; from the resulted chart read the value of the Fc and
apply the formula: Fb=
(Fl 2 + Fh 2 – Fc 2) ½
Knowing the Fb we now know if the chosen tuning has been respected or not; varying the port length and repeating the measurement we can catch up the wished tuning frequency; just keep in mind that a longer tube reduces the Fb, keeping box volume and port diameter the same. Looking at the chart, we can see (blue line) various peaks: we must try to avoid them, since colorations in sound will occur; let's try to understand what caused those peaks. Those marked with the green arrows are a result of the box standing waves; in fact if we apply the F=345/2d formula, where for d is one of the dimensions of the box expressed in meters, we will have F1 =345/1.91=180.6 Hz; we repeat the calculation for the others two dimensions and have F2 = 917,5, F3 = 791.2. This is an example of how the impedance measurement can help us identify the interaction between the driver and the box, and it helps us to verify if the taken countermeasures (absorbent, wall reinforce etc.) have succeeded to diminish or to cancel the problem (because the resonances created by the box are a problem!). The two other peaks (fuchsia arrows), that correspond to the dimensions of 6.4 and 15.5 cm. approximately, are of the Focal itself as you can notice from the chart below, therefore we have to keep them.
|
|
|
Impedance as given by Focal |
I think the impedance graph can give us a lot of useful information that help to understand the interaction driver-box and also let us know if the resonances cure worked out or not; besides if there is a peak in the impedance we will find it, as well, in the acoustic measure !